GBDTE log‑loss dataset
In this post I want to solemnly declare: I'm not a mathematician. My friends who are, I'm totally sure, would solve this problem without effort using Bayes' formalism. I can only wave my hands.
So, what's the fuss?
I want to generate a synthetic dataset with properties similar to those of the initial fraudulent‑users dataset. And I want to control how much information the features bring about the target value. Moreover, I want to introduce a new variable to the dataset—t (time)—and add time dependence to the dataset's statistical properties.
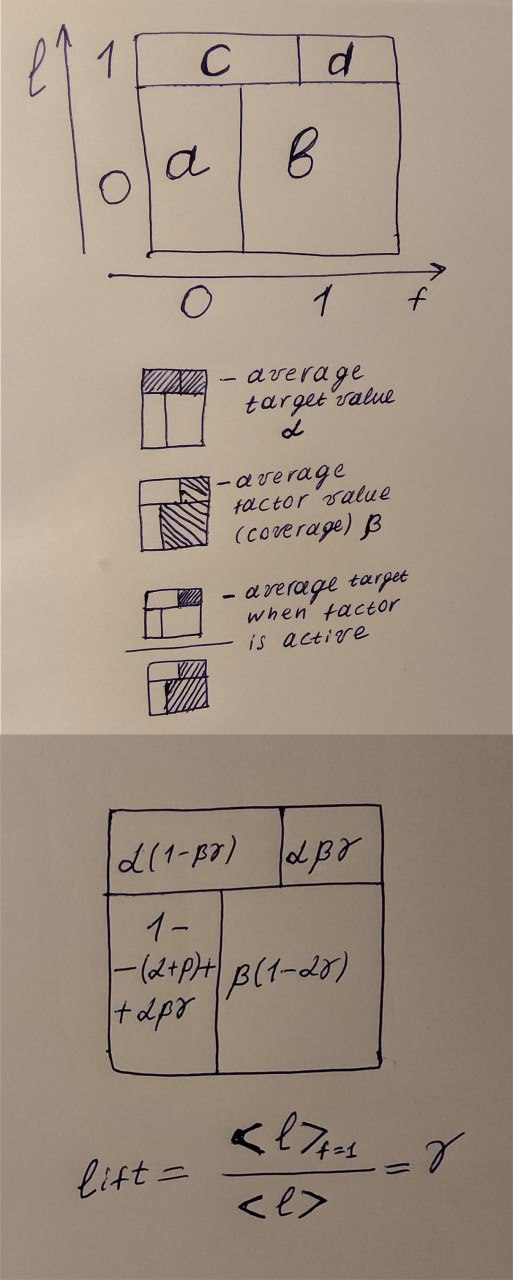
Because of my math inaptitude, I use my intuition from physics problem‑solving. First, let's draw the figure you see in the picture. The horizontal axis stands for the binary factor f (feature). The vertical axis stands for the binary target l (label). The height of the horizontal line that splits l=0 and l=1 has a well‑defined meaning—it's the average value of our target, α. Let α = 0.5. That's the second equation, because the first is a + b + c + d = 1.
Then we can think about the average value of the factor. I want to have 16 factors in my dataset, and I want them, in total, to give slightly less information than would allow 100% recovery of the target. So the average factor value β should be 1/16 = 0.0625. β is the coverage—how often the factor equals 1. Third equation.
And finally, the lift. It's a ratio: in the numerator is the probability that the target equals 1 when the factor equals 1, and in the denominator is the average target value. In terms of our variables, d/(d+b) is the average target when f = 1, and α is the average target value.
When lift = 1, the factor gives no information about the target. When it's > 1, it shows how much stronger our position is when using this factor. For example, a lift of 1.3 shows that we would catch 30% more credit‑fraud users when using this factor. It's convenient to use log‑lift: it is 0 when there is no gain and has the same sign as the correlation between the target and the factor.
For my dataset I want time to run from 0 to 1, and I want two groups of factors: with the lift going up and with the lift going down. The expressions for these lifts are quite simple:
lift_up = 0.25 + 0.5*t
lift_down = 0.75 - 0.5*t
Now we have four variables and four equations to determine them. I solved the system using Gaussian elimination, and the result is in the lower picture.
I'm going to implement these expressions in the synthetic dataset generation script. It's already done, but I wanted to recap the logic behind it. Next time—the dataset.