Tree. From Gradient Boosted Decision Trees.
In playing with some technology or algorithm, my favorite moment is that elusive, transitional state when it’s still a little bit “wtf?” and yet already a solid—though not yet boring—tool. Gradient-Boosted Decision Trees with Extrapolation (GBDTE) is exactly there right now.
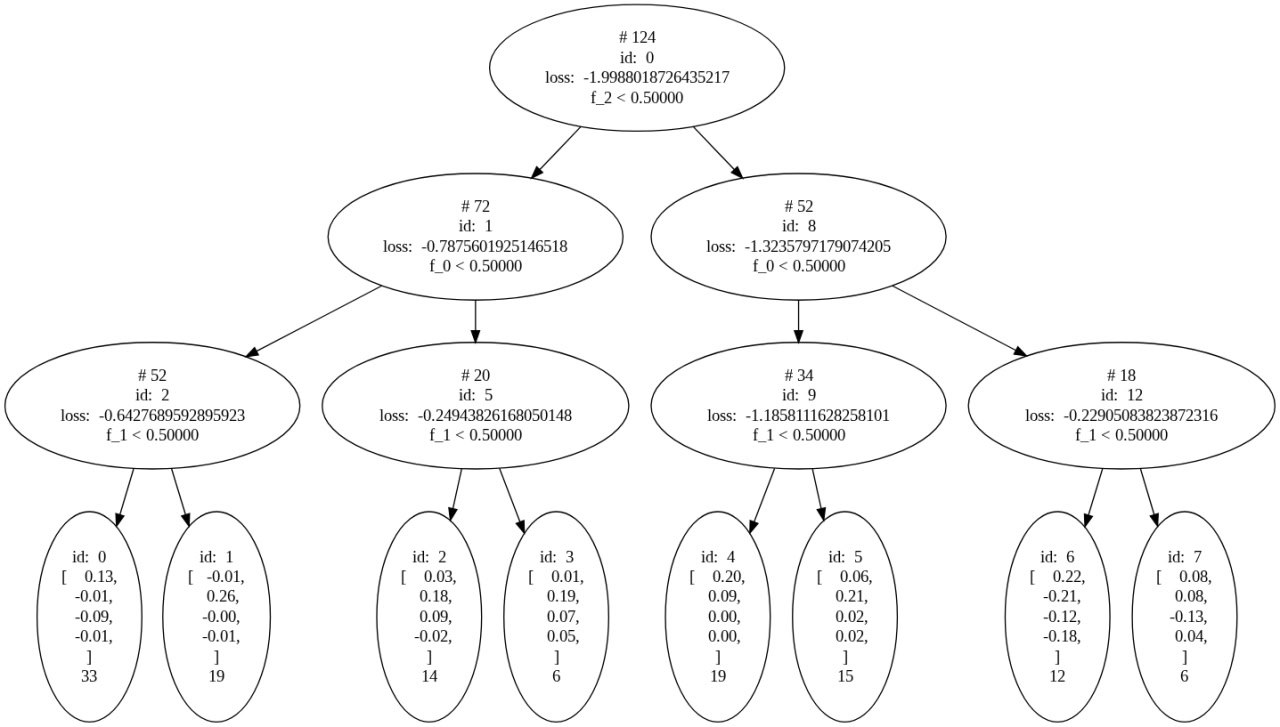
In earlier posts I explained how I built a dataset for testing this ML idea. The image shows one training step of the algorithm on that dataset. Let’s unpack what’s going on. In the next post I’ll introduce the four basis functions: 1, t, sin(kt), cos(kt). Our dataset contains eight groups of points, and each group is a linear combination of those basis functions. So the model’s task is two-part: first, classify points and assign them to a group; second, fit the best approximation for each group.
Let’s check ourselves. In a later post I highlight two of the most prominent groups. We’ll locate them in the tree, inspect their weights, then find them on the picture and compare our interpretation with the graphs.
Just for fun, let's inspect the bubble with id=4. Read from top to bottom: 0.20 means that when t = 0 this component should have value 0.2. Next 0.09 value means that we have slightly rising trend. For sin and cos we have zeros. It means that there is no oscillations in this component. Now we can find out values of f-parameters which describe this component. One should take "right-left-left" route from root, in terms of factor values it's (0, 0, 1). Be careful, on tree picture factors are f0, f1, f2. On pictures with components - f1, f2, f3. My bad. Check picture below. You will see that our description of this component is totally correct. It works!
In the opposite direction: the second component has much steeper tilt, we can expect bigger value of the second component. Curve rises, so the second component in a leaf is positive. Intersection with Oy is lower, so the first component of a leaf should be close to zero. Some oscillations are visible, but not very prominent. We can expect non-zero small third and fourth components. Static factors are (0, 1, 0), it reads like left, left, right sequence on the tree diagram and leads into the node with id:1. Weights are -0.01, 0.26, 0, -0.01. I think, perfect match.
And the third curve: 1, 0, 0 - left, right, left - id=2; weights 0.03, 0.18, 0.09, -0.02; finally has quite a prominent harmonic part and it is totally visible on the curve.
Quite an impressive result for one step of the algorithm, isn't it?
When trends in general are quite good and the tree corresponds to the graph, there is one small issue which bothers me. MSE shows mismatch on the level of 0.0003. I don't understand why. Yet.