How to find linear superposition in chaos
Now we have a set of points which, while fairly random from a mathematical point of view, give us a depiction of the “Extra Boost” sign. For my method, I need to find several groups, each represented by a linear combination of basis functions. I set time (t) to go from left to right, from 0 to 1. The basis functions are [1,t, sin(kt), cos(kt)], so the extrapolating function is (Expression below).
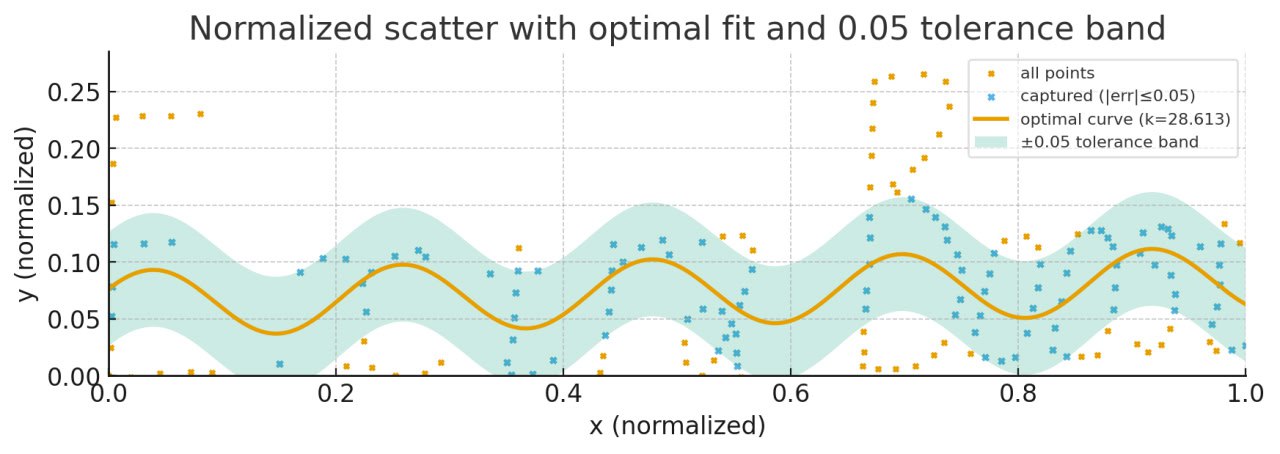
Weights (A,B,C,D) can be estimated from the dataset using least squares, but we still need to pick k. After a set of experiments I chose k=50: it gives a convenient scale—the wavelength is roughly the width of a letter.
With this setup I obtained the picture you see at the beginning of the article. Then I decided the tolerance was too large and reduced the band width.
Here we are: a narrow band.
Next, I removed points within the tolerance range and repeated the process. To my surprise, after the first iteration nothing changed.
You can see that the dots disappeared, but the curve didn’t change. After a while I understood why. It was vibe-coding: I asked my iron friend to find a curve that captures the highest number of points; instead, it wrote code that minimizes MSE. That approach has an interesting property: when you delete points lying on the curve, the MSE is unchanged, so the same curve remains optimal.
I told the iron friend that, instead of minimizing squared distance to the points, it should maximize the number of captured points. It proposed the RANSAC approach, which was new to me: repeatedly select four random points, fit the curve, count captured points, and keep the candidate with the most inliers. It worked.
I ran the process iteratively, and it decomposed the figure into a superposition of functions. Unfortunately, the upper half of “B” wasn’t captured. I suspected the issue was the different heights of lowercase and uppercase letters and created a second version of the drawing.
The same procedure gave me the sign decomposed into eight components, each a superposition of the basis functions.
Finally, I encoded the group number as a 0–1 vector of static features f1,f2,f3 and exported the dataset as CSV. Hooray — now we have data to test the MSE mode of the EXTRA BOOST model.